By subdomain
The full picture: every mapped WEC subdomain, statewide, 2020–2024
This page gives the complete subdomain-level detail behind the overview. Each entry shows the statewide proportion of students reporting high well-being over time (2020–2024) and across year levels (2024), with a trend classification. Subdomains are grouped by their place in the PEM framework. Reading direction is consistent throughout: higher is always better, including for the “absence-of” items such as sadness, worries and bullying, which the WEC reverse-codes so that high means doing well.
Trend types are fitted on five annual points (2020–2024) and capped at Type 2 (quadratic). Cubic Type 3 patterns need the longer 2018–2024 series; see Method & mapping.
| Subdomain | PEM construct | 2020 | 2024 | Trend | Pattern |
|---|---|---|---|---|---|
| Sleep | Physical | 55% | 54% | Type 2 | dip then recovery |
| Sports | Physical | 51% | 53% | Type 2 | dip then recovery |
| Nutrition - breakfast | Physical | 67% | 62% | Type 2 | dip then recovery |
| Connectedness to school | Environmental | 61% | 60% | Type 1− | steady decline |
| Peer belonging | Environmental | 51% | 51% | Type 1− | steady decline |
| School climate | Environmental | 35% | 33% | Type 2 | rise then fall |
| School belonging | Environmental | 41% | 41% | Type 1− | steady decline |
| Happiness | Mental/Emotional | 51% | 52% | Type 2 | dip then recovery |
| Optimism | Mental/Emotional | 43% | 44% | Type 2 | dip then recovery |
| Sadness | Mental/Emotional | 48% | 49% | Type 0 | broadly stable |
| Worries | Mental/Emotional | 37% | 39% | Type 0 | broadly stable |
| Emotion regulation | Mental/Emotional | 34% | 35% | Type 0 | broadly stable |
| Academic self concept | Relationships | 61% | 57% | Type 1− | steady decline |
| Cognitive engagement | Relationships | 46% | 43% | Type 1− | steady decline |
| Perseverance | Relationships | 41% | 39% | Type 1− | steady decline |
| Social bullying | Relationships | 50% | 57% | Type 2 | rise then fall |
| Verbal bullying | Relationships | 45% | 50% | Type 2 | rise then fall |
| Physical bullying | Relationships | 63% | 69% | Type 2 | rise then fall |
| Cyberbullying | Relationships | 75% | 78% | Type 2 | rise then fall |
| Friendship intimacy | Relationships | 69% | 69% | Type 0 | broadly stable |
| Emotional engagement with teachers | Relationships | 70% | 67% | Type 1− | steady decline |
| Music and arts | Perivallon | 48% | 45% | Type 2 | dip then recovery |
| Organised activities | Perivallon | 76% | 78% | Type 2 | dip then recovery |
Physical
Dimension of well-being.
Sleep
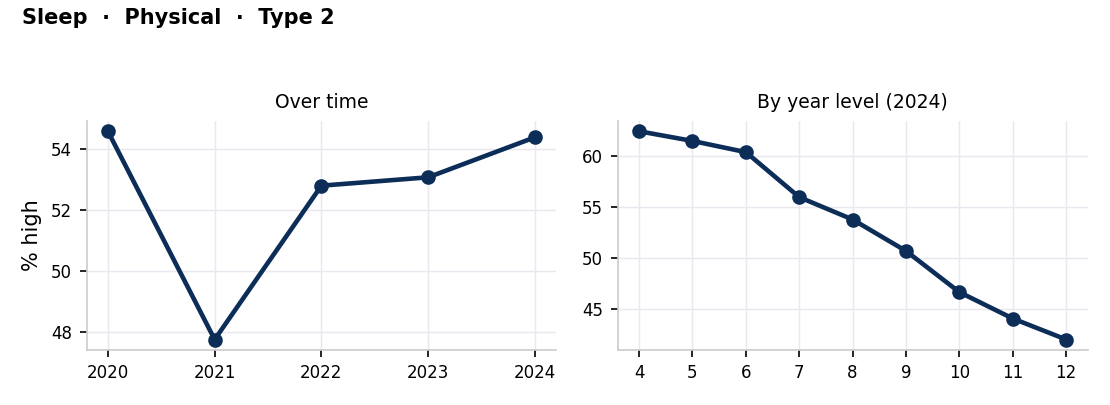
Statewide, high well-being on sleep held roughly steady over 2020–2024 (about 55% to 54%), classified Type 2 (dip then recovery). Across year levels it drops sharply across the middle years (Year 4 ≈ 62%, Year 9 ≈ 51%, Year 12 ≈ 42%).
Sports
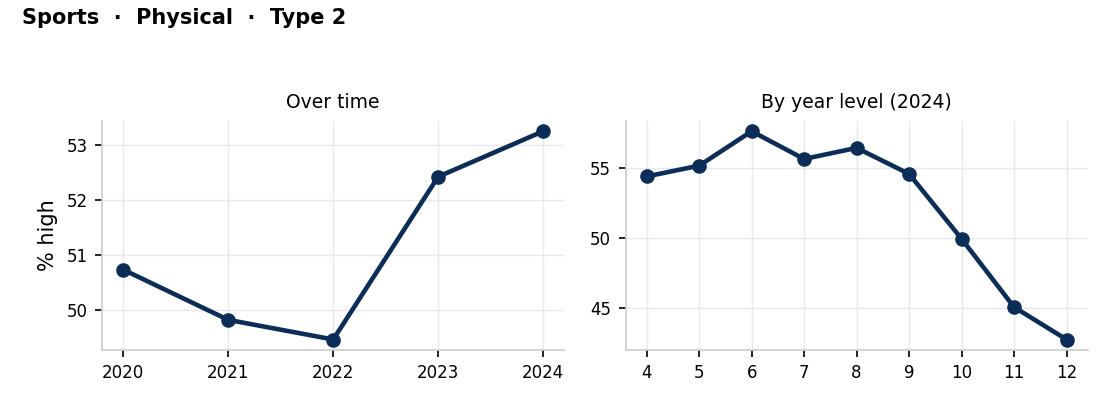
Statewide, high well-being on sports rose over 2020–2024 (about 51% to 53%), classified Type 2 (dip then recovery). Across year levels it declines into the senior years (Year 4 ≈ 54%, Year 9 ≈ 55%, Year 12 ≈ 43%).
Nutrition - breakfast
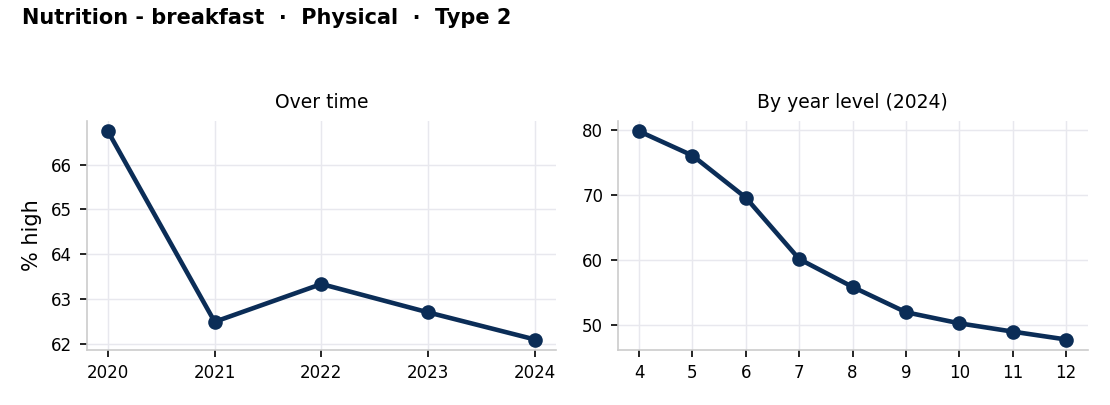
Statewide, high well-being on nutrition - breakfast fell over 2020–2024 (about 67% to 62%), classified Type 2 (dip then recovery). Across year levels it drops sharply across the middle years (Year 4 ≈ 80%, Year 9 ≈ 52%, Year 12 ≈ 48%).
Environmental
Dimension of well-being.
Connectedness to school
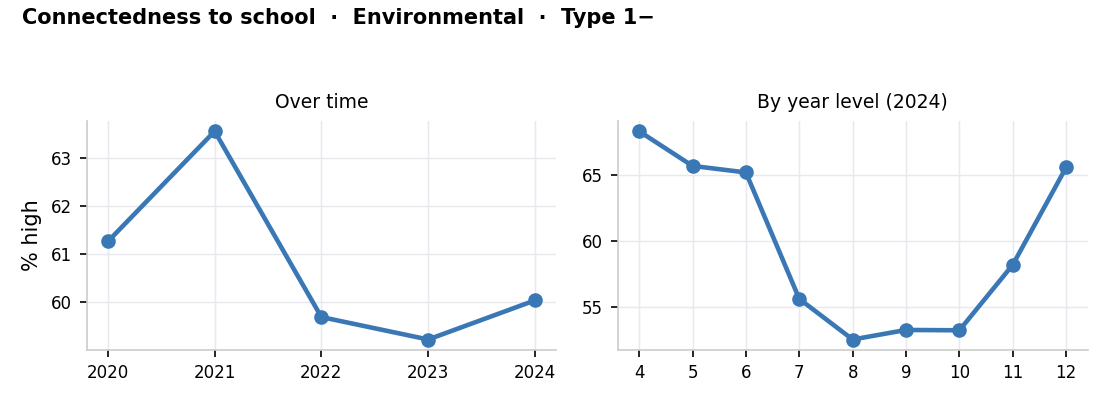
Statewide, high well-being on connectedness to school fell over 2020–2024 (about 61% to 60%), classified Type 1− (steady decline). Across year levels it drops sharply across the middle years (Year 4 ≈ 68%, Year 9 ≈ 53%, Year 12 ≈ 66%).
Peer belonging
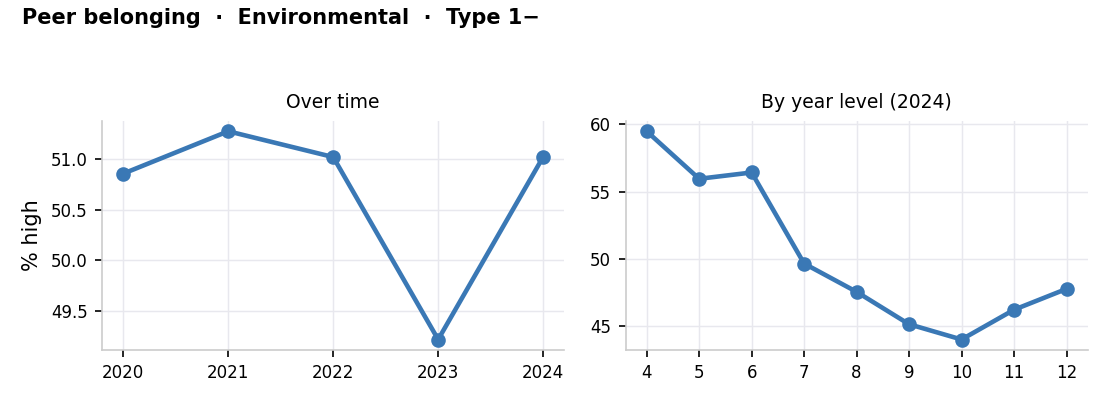
Statewide, high well-being on peer belonging held roughly steady over 2020–2024 (about 51% to 51%), classified Type 1− (steady decline). Across year levels it drops sharply across the middle years (Year 4 ≈ 59%, Year 9 ≈ 45%, Year 12 ≈ 48%).
School climate
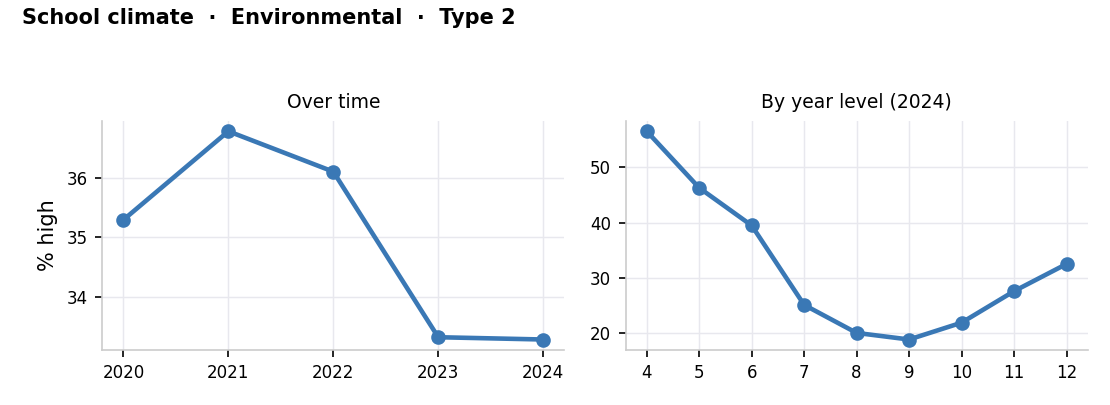
Statewide, high well-being on school climate fell over 2020–2024 (about 35% to 33%), classified Type 2 (rise then fall). Across year levels it drops sharply across the middle years (Year 4 ≈ 57%, Year 9 ≈ 19%, Year 12 ≈ 33%).
School belonging
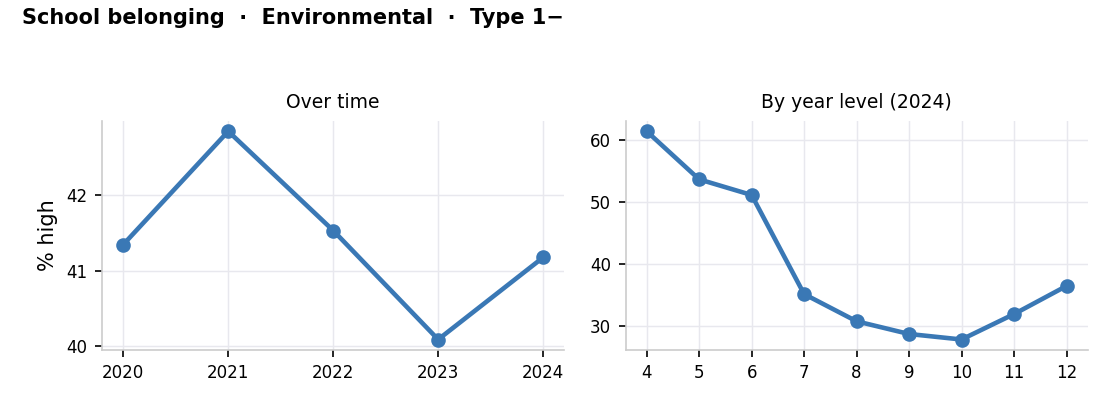
Statewide, high well-being on school belonging held roughly steady over 2020–2024 (about 41% to 41%), classified Type 1− (steady decline). Across year levels it drops sharply across the middle years (Year 4 ≈ 61%, Year 9 ≈ 29%, Year 12 ≈ 36%).
Mental/Emotional
Dimension of well-being.
Happiness
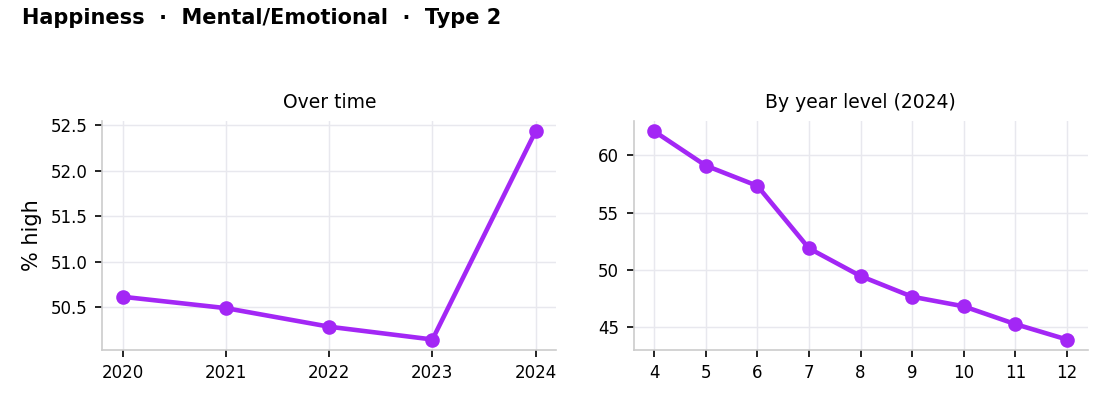
Statewide, high well-being on happiness rose over 2020–2024 (about 51% to 52%), classified Type 2 (dip then recovery). Across year levels it drops sharply across the middle years (Year 4 ≈ 62%, Year 9 ≈ 48%, Year 12 ≈ 44%).
Optimism
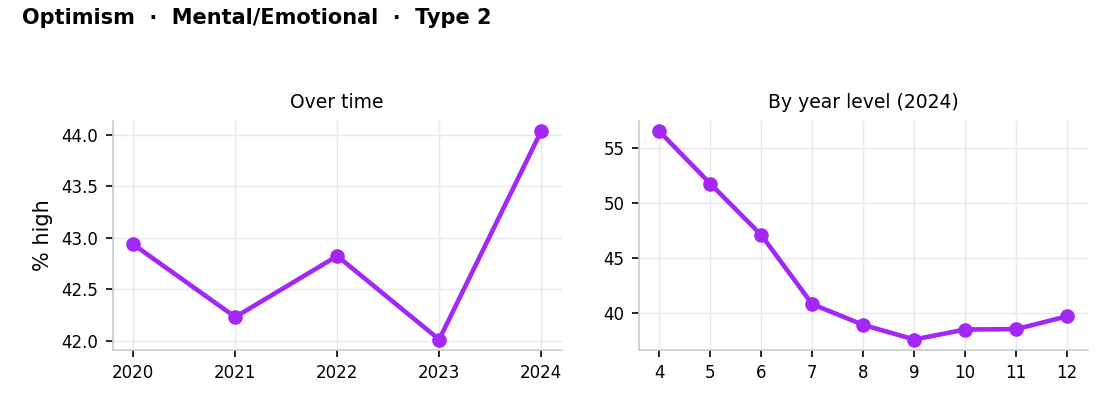
Statewide, high well-being on optimism rose over 2020–2024 (about 43% to 44%), classified Type 2 (dip then recovery). Across year levels it drops sharply across the middle years (Year 4 ≈ 57%, Year 9 ≈ 38%, Year 12 ≈ 40%).
Sadness
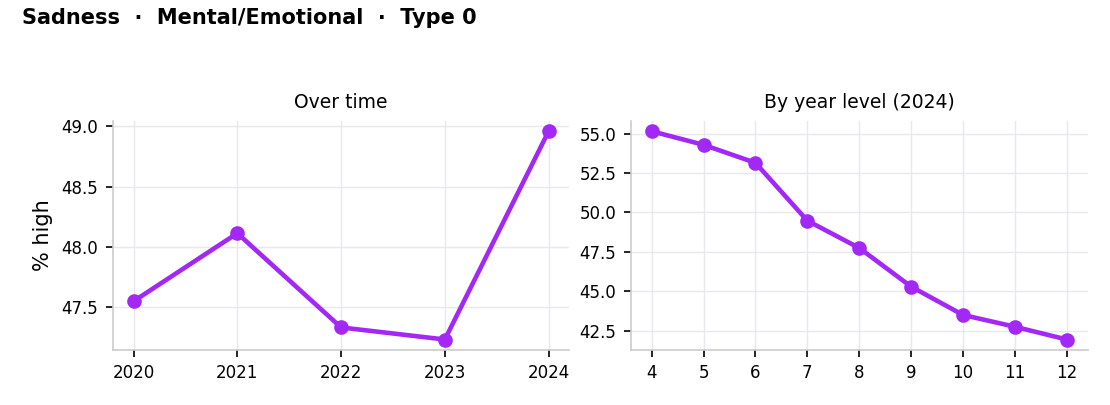
Statewide, high well-being on sadness rose over 2020–2024 (about 48% to 49%), classified Type 0 (broadly stable). Across year levels it drops sharply across the middle years (Year 4 ≈ 55%, Year 9 ≈ 45%, Year 12 ≈ 42%).
Worries
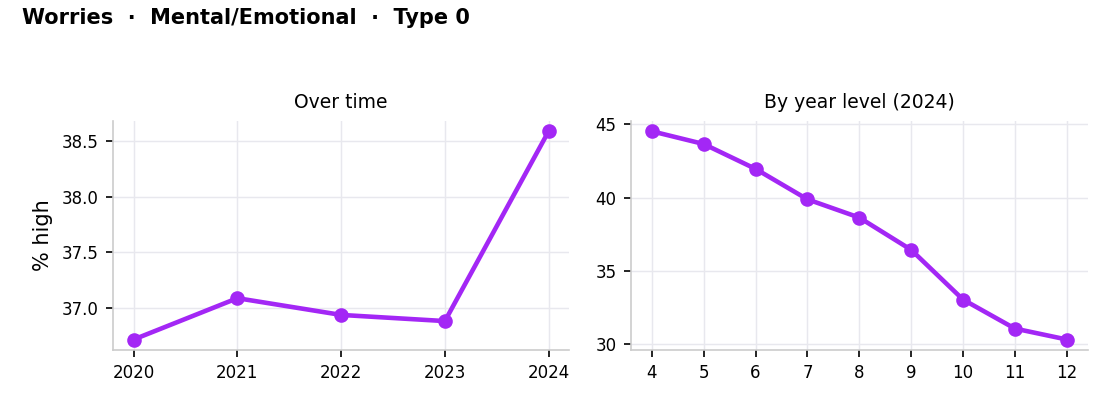
Statewide, high well-being on worries rose over 2020–2024 (about 37% to 39%), classified Type 0 (broadly stable). Across year levels it drops sharply across the middle years (Year 4 ≈ 45%, Year 9 ≈ 36%, Year 12 ≈ 30%).
Emotion regulation
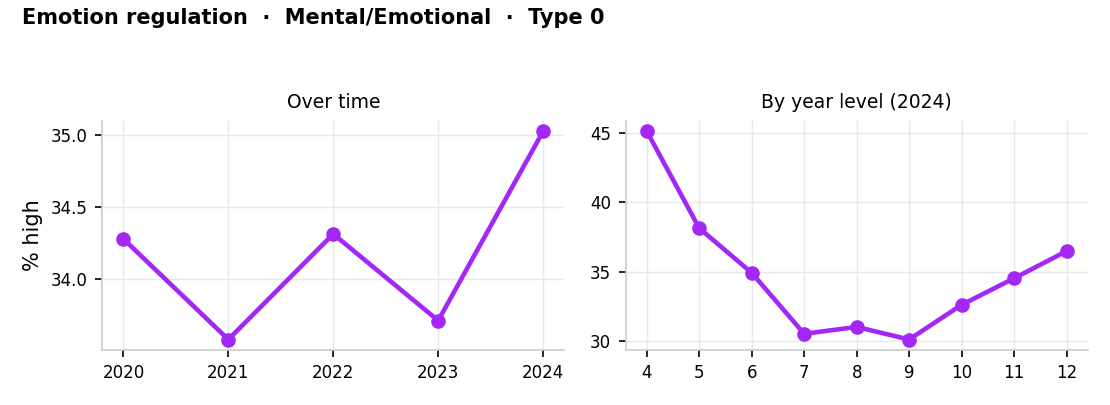
Statewide, high well-being on emotion regulation held roughly steady over 2020–2024 (about 34% to 35%), classified Type 0 (broadly stable). Across year levels it drops sharply across the middle years (Year 4 ≈ 45%, Year 9 ≈ 30%, Year 12 ≈ 36%).
Relationships
Influencing factor.
Academic self concept
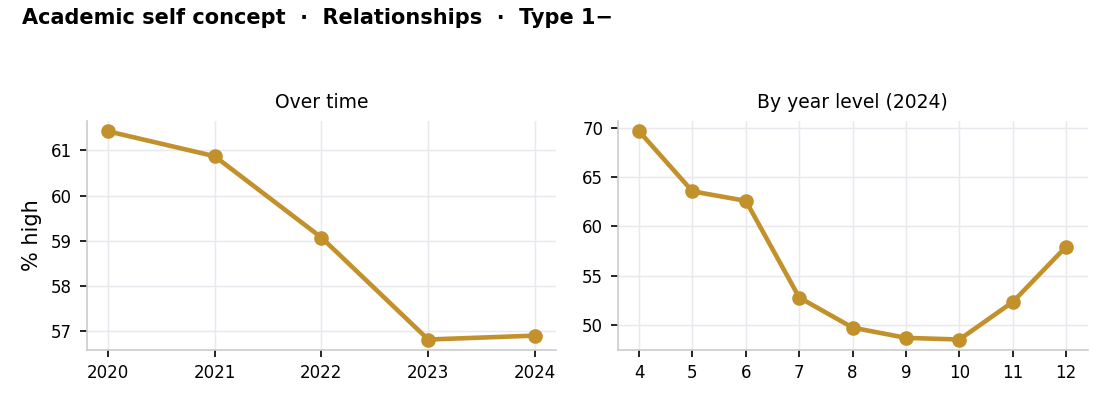
Statewide, high well-being on academic self concept fell over 2020–2024 (about 61% to 57%), classified Type 1− (steady decline). Across year levels it drops sharply across the middle years (Year 4 ≈ 70%, Year 9 ≈ 49%, Year 12 ≈ 58%).
Cognitive engagement
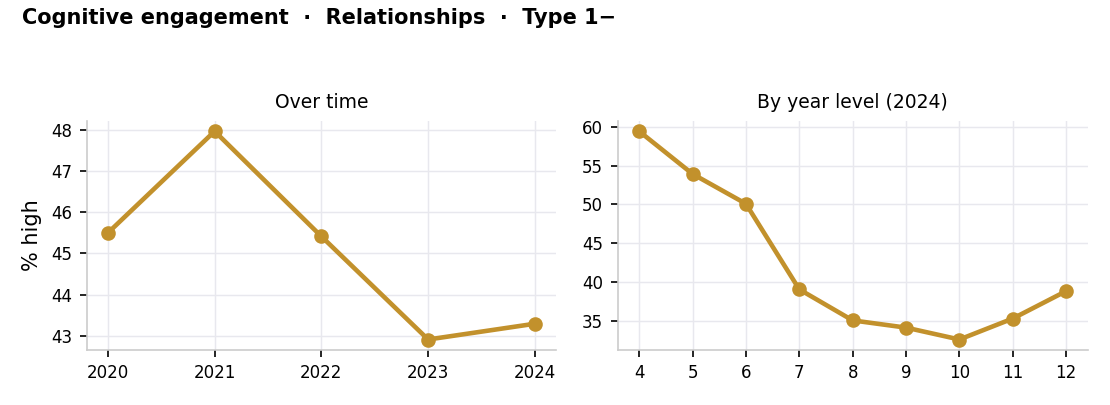
Statewide, high well-being on cognitive engagement fell over 2020–2024 (about 46% to 43%), classified Type 1− (steady decline). Across year levels it drops sharply across the middle years (Year 4 ≈ 59%, Year 9 ≈ 34%, Year 12 ≈ 39%).
Perseverance
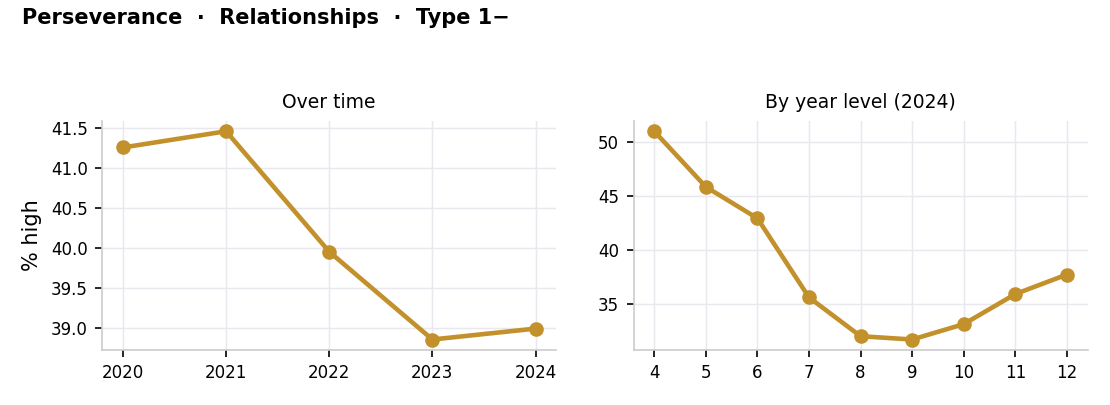
Statewide, high well-being on perseverance fell over 2020–2024 (about 41% to 39%), classified Type 1− (steady decline). Across year levels it drops sharply across the middle years (Year 4 ≈ 51%, Year 9 ≈ 32%, Year 12 ≈ 38%).
Verbal bullying
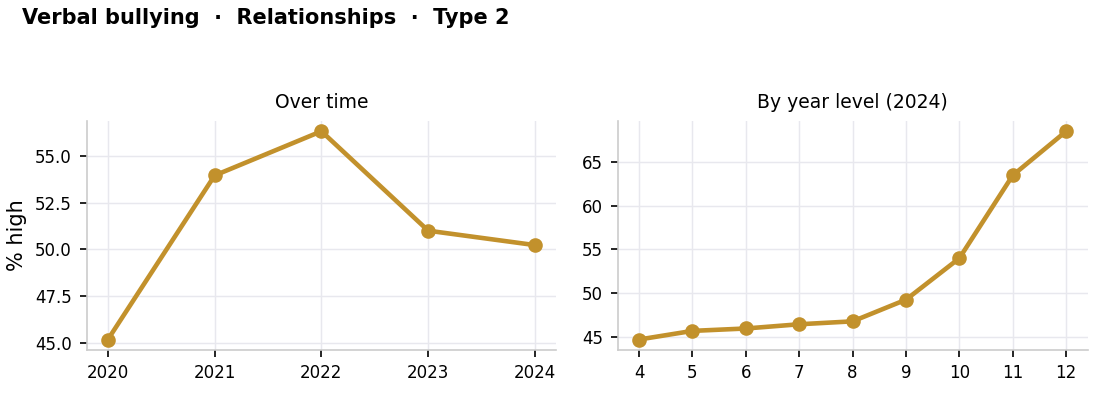
Statewide, high well-being on verbal bullying rose over 2020–2024 (about 45% to 50%), classified Type 2 (rise then fall). Across year levels it is relatively flat across year levels (Year 4 ≈ 45%, Year 9 ≈ 49%, Year 12 ≈ 68%).
Physical bullying
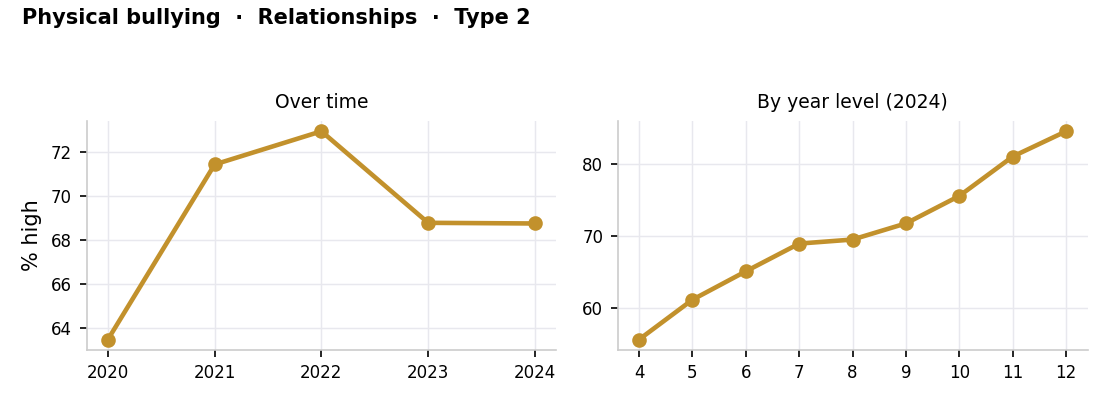
Statewide, high well-being on physical bullying rose over 2020–2024 (about 63% to 69%), classified Type 2 (rise then fall). Across year levels it is relatively flat across year levels (Year 4 ≈ 56%, Year 9 ≈ 72%, Year 12 ≈ 85%).
Cyberbullying
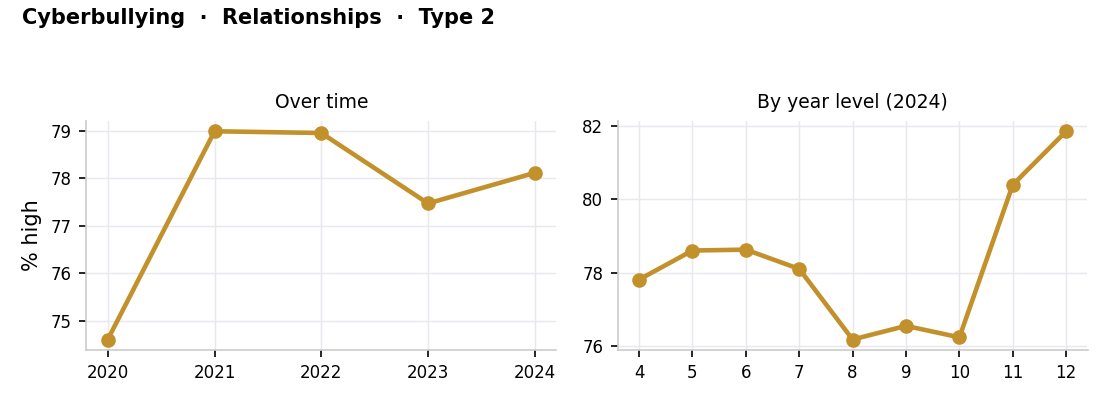
Statewide, high well-being on cyberbullying rose over 2020–2024 (about 75% to 78%), classified Type 2 (rise then fall). Across year levels it is relatively flat across year levels (Year 4 ≈ 78%, Year 9 ≈ 77%, Year 12 ≈ 82%).
Friendship intimacy
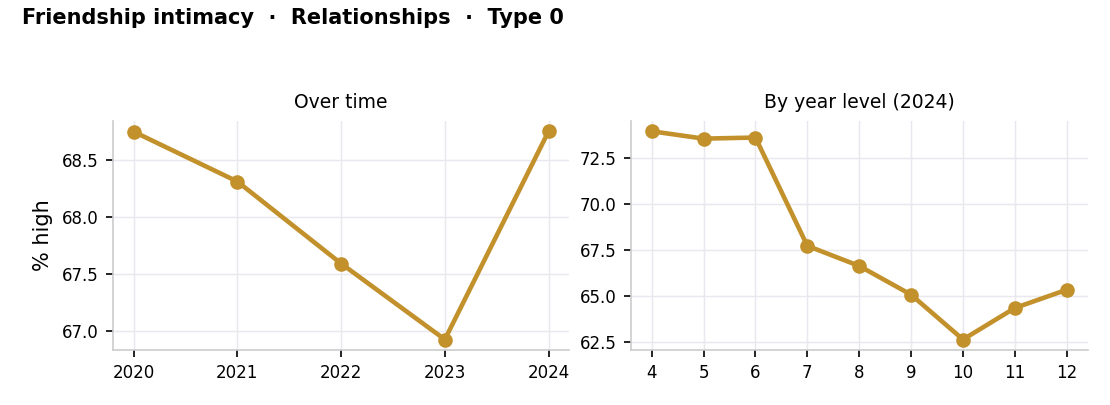
Statewide, high well-being on friendship intimacy held roughly steady over 2020–2024 (about 69% to 69%), classified Type 0 (broadly stable). Across year levels it drops sharply across the middle years (Year 4 ≈ 74%, Year 9 ≈ 65%, Year 12 ≈ 65%).
Emotional engagement with teachers
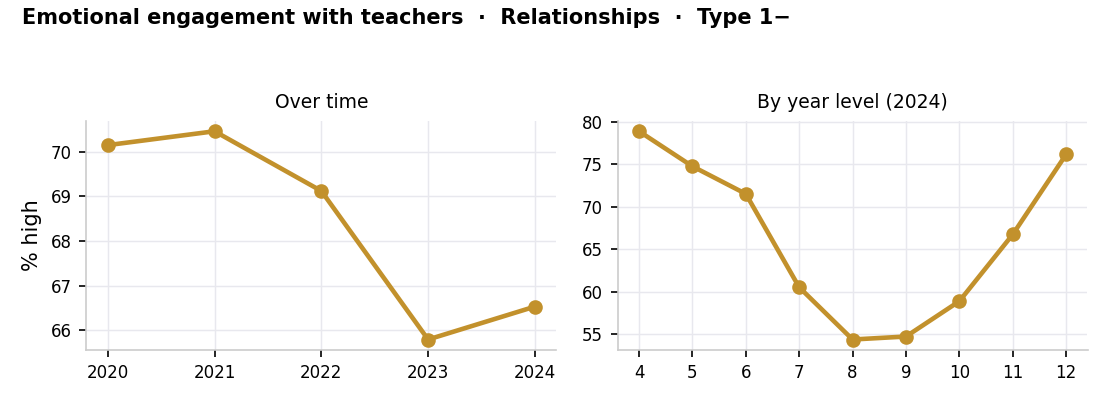
Statewide, high well-being on emotional engagement with teachers fell over 2020–2024 (about 70% to 67%), classified Type 1− (steady decline). Across year levels it drops sharply across the middle years (Year 4 ≈ 79%, Year 9 ≈ 55%, Year 12 ≈ 76%).
Perivallon
Influencing factor.
Music and arts
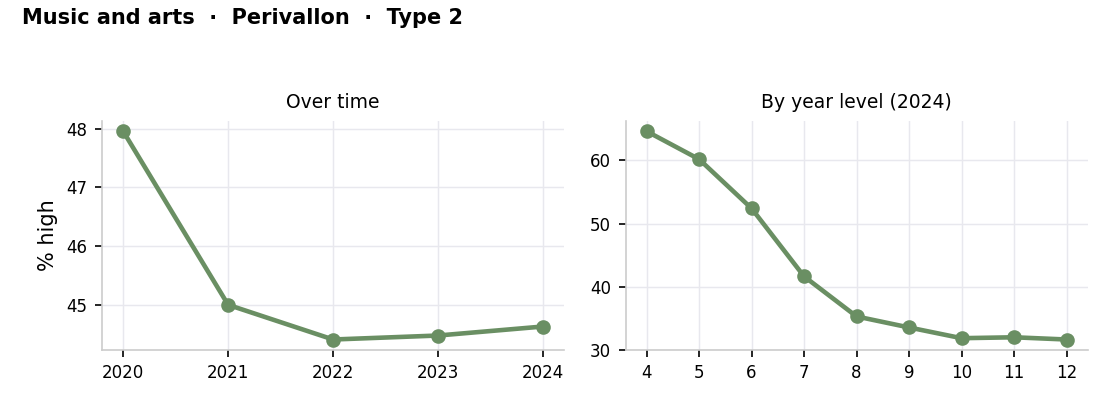
Statewide, high well-being on music and arts fell over 2020–2024 (about 48% to 45%), classified Type 2 (dip then recovery). Across year levels it drops sharply across the middle years (Year 4 ≈ 65%, Year 9 ≈ 34%, Year 12 ≈ 32%).
Organised activities
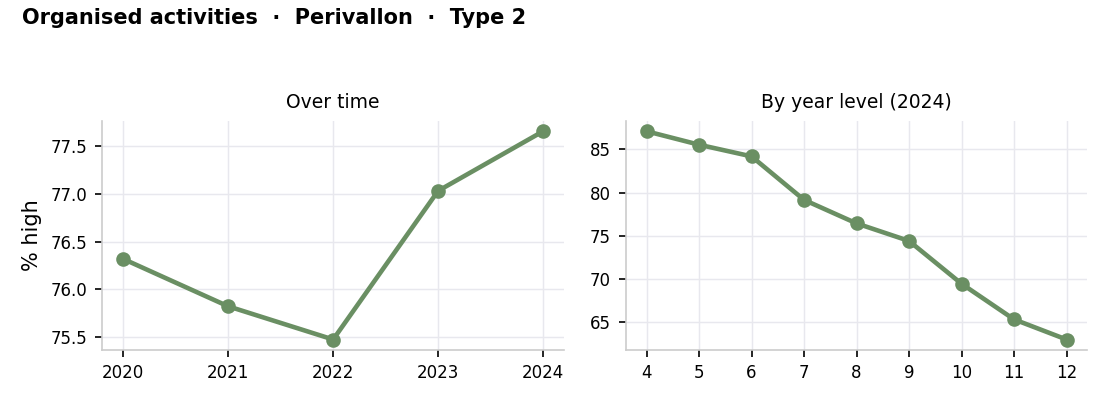
Statewide, high well-being on organised activities rose over 2020–2024 (about 76% to 78%), classified Type 2 (dip then recovery). Across year levels it drops sharply across the middle years (Year 4 ≈ 87%, Year 9 ≈ 74%, Year 12 ≈ 63%).
Social bullying
Statewide, high well-being on social bullying rose over 2020–2024 (about 50% to 57%), classified Type 2 (rise then fall). Across year levels it is relatively flat across year levels (Year 4 ≈ 49%, Year 9 ≈ 58%, Year 12 ≈ 68%).