South Australia: a state-level overview
Where students actually are, read through the PEM framework. Wellbeing & Engagement Collection, Years 4–12, 2020–2024.
This overview does for South Australia what an Equilibria school report does for a single school: it starts by seeing where students actually are, before anyone reaches for what to change. It reads the Wellbeing & Engagement Collection (WEC) — the state’s largest annual student survey — through the PEM model of well-being, which treats a young person’s well-being as a balance across three dimensions (physical, environmental, mental/emotional) acted on by three external influences (relationships, perivallon, and student voice).
Throughout, the headline measure is the proportion of students reporting high well-being, and the direction is consistent: higher is always better. For the “absence-of” items such as sadness, worries and bullying, the WEC reverse-codes responses so that high still means doing well.
Scope. Years 4–12, statewide, 2020–2024. Totals are built from the year-level collections and run about 1–2% below the official “All SA” figures because they exclude the small “Primary/Secondary Other” and “Unknown” groups. 2020 was a Term-3, COVID-affected collection. Gender is not included in this first version. See Method & mapping.
The balance, 2024
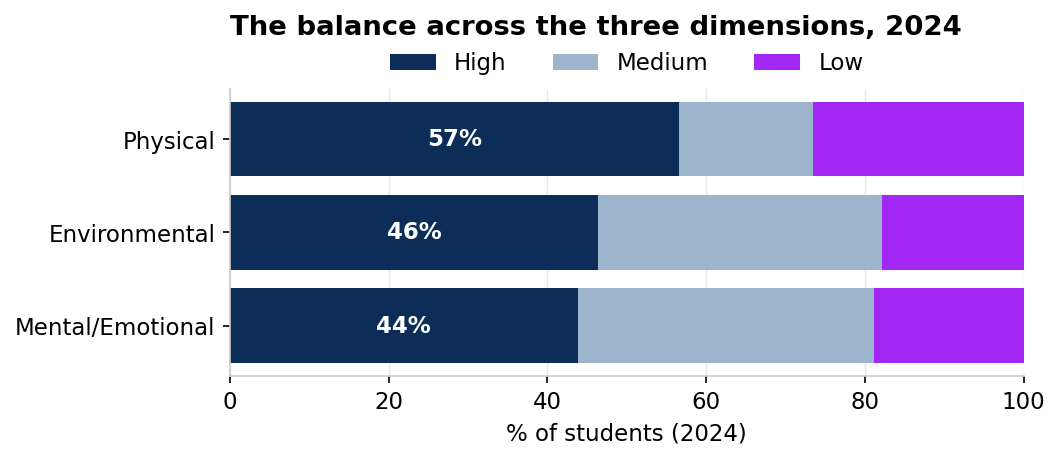
The first thing the framework asks is whether the three dimensions are in equilibrium. In 2024 they are not. Physical well-being sits highest at around 57% high, while environmental (≈46%) and mental/emotional (≈44%) sit markedly lower, with roughly one in five students in the low band on each. A single overall “well-being score” would blur this; the model’s value is that it shows the balance is tipped toward the internal, harder-to-see dimensions, which is precisely where a one-size-fits-all program is least likely to land.
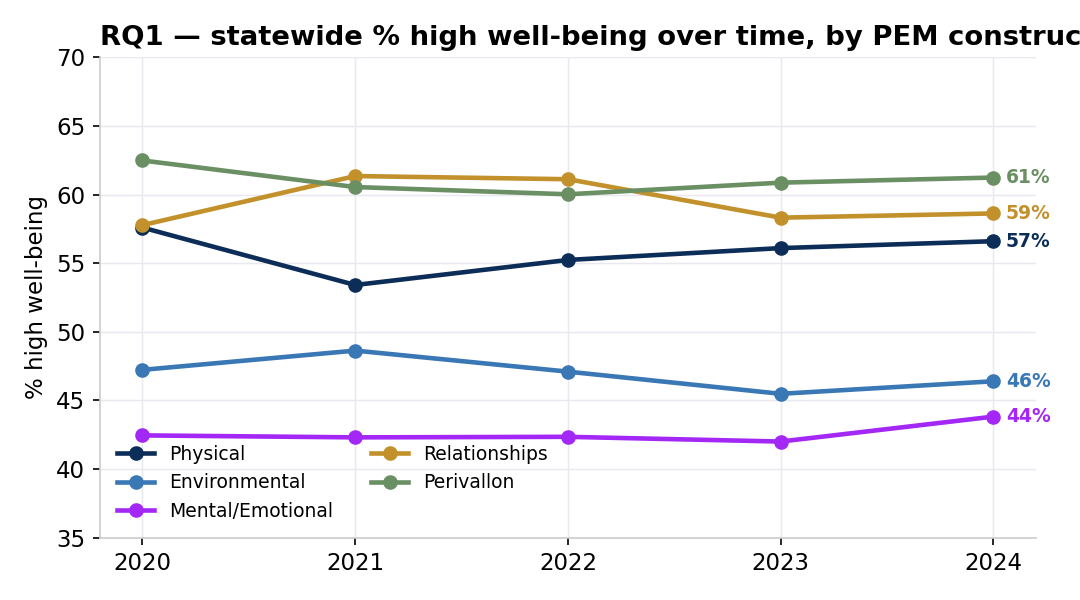
RQ1 — how the balance has shifted over time
| PEM construct | 2020 | 2021 | 2022 | 2023 | 2024 |
|---|---|---|---|---|---|
| Physical | 58% | 53% | 55% | 56% | 57% |
| Environmental | 47% | 49% | 47% | 45% | 46% |
| Mental/Emotional | 42% | 42% | 42% | 42% | 44% |
| Relationships | 58% | 61% | 61% | 58% | 59% |
| Perivallon | 62% | 61% | 60% | 61% | 61% |
Across the window the state picture is one of a low equilibrium that has not recovered. Physical well-being dipped in 2021 and clawed most of it back; the relationships and perivallon factors held broadly steady. But mental/emotional well-being has stayed stuck in the low forties, and environmental well-being has drifted down. The clearest declines are not in the mood items at all but in the engagement-with-learning indicators grouped under relationships (academic self-concept, cognitive engagement, perseverance) and in belonging, while the bullying indicators actually improved. (The fuller 2018–2019 baseline, available in the data, sits several points higher and is discussed in Method & mapping.)
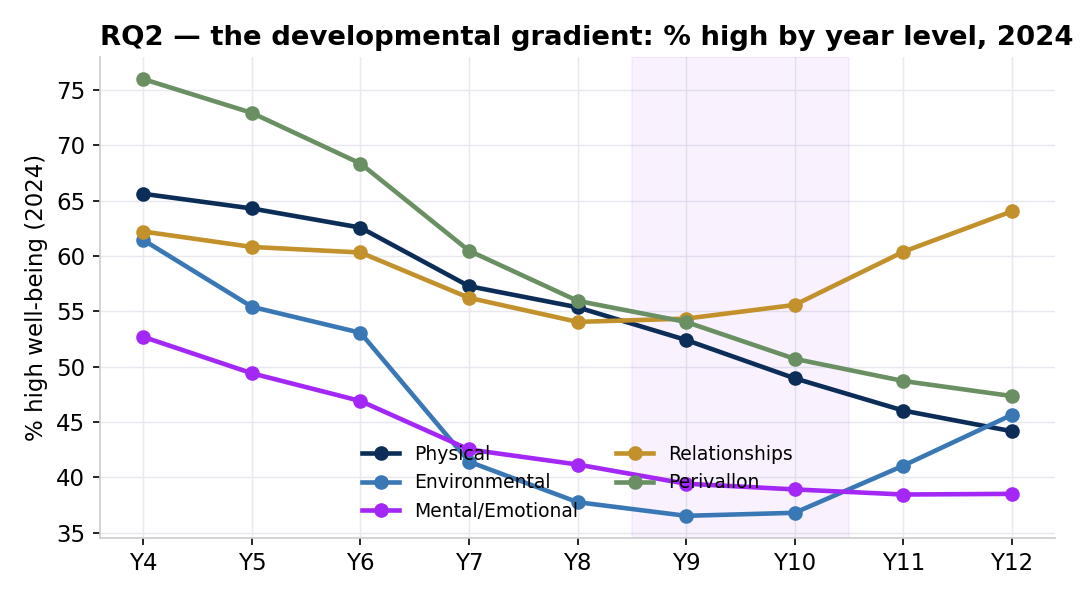
RQ2 — the developmental gradient
| PEM construct | Y4 | Y5 | Y6 | Y7 | Y8 | Y9 | Y10 | Y11 | Y12 |
|---|---|---|---|---|---|---|---|---|---|
| Physical | 66% | 64% | 63% | 57% | 55% | 52% | 49% | 46% | 44% |
| Environmental | 61% | 55% | 53% | 41% | 38% | 37% | 37% | 41% | 46% |
| Mental/Emotional | 53% | 49% | 47% | 43% | 41% | 39% | 39% | 38% | 39% |
| Relationships | 62% | 61% | 60% | 56% | 54% | 54% | 56% | 60% | 64% |
| Perivallon | 76% | 73% | 68% | 60% | 56% | 54% | 51% | 49% | 47% |
This is the most striking pattern in the data, and the one that most vindicates a balance model over a score model. Nearly every dimension and factor declines from Year 4 into a trough around Years 9–10, and they do so together. Perivallon (after-school music, arts and organised activity) falls furthest, from about 76% in Year 4 to the high-40s by senior school. Environmental well-being collapses from ~61% to the high-30s by Year 9 before partially recovering. Relationships and environmental well-being rebound in Years 11–12; mental/emotional well-being does not. A school looking only at a whole-of-school average would miss that its Year 9 cohort is simultaneously under pressure on several interacting fronts.
The influencing factors — and the Voice gap
The PEM model treats relationships, perivallon and voice as the external levers that act on the three dimensions. Two of the three are measured well by the WEC and one is not measured at all:
- Relationships are richly covered (teacher relationships, friendship intimacy, belonging, and the four bullying types). Teacher relationships are a state-wide strength (~67% high) but have softened slightly; bullying indicators have improved.
- Perivallon is captured through after-school participation, which shows the steepest developmental decline of anything in the dataset.
- Student voice has no corresponding WEC indicator. This is not a flaw in the analysis but a finding in its own right: the state’s flagship instrument does not measure one of the three things the framework treats as central to well-being. It is exactly the kind of blind spot the Equilibria approach exists to make visible.
A feedback loop you can see in the data
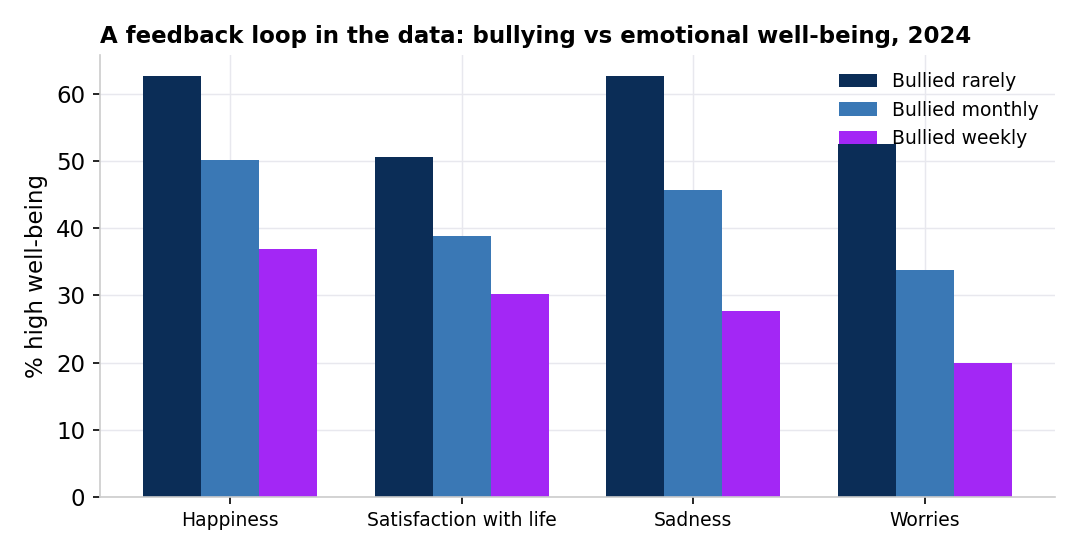
The model claims the factors and dimensions form reinforcing loops rather than tidy one-way causes. The WEC’s own cross-tabulation of bullying frequency against emotional well-being shows one such loop directly: among students rarely bullied, around 63% report high happiness; among those bullied weekly, that more than halves, while low satisfaction, sadness and worries climb steeply. Relationship experiences and mental/emotional well-being move together, which is why acting on one without seeing the other tends to disappoint.
What this overview is for
Read through the framework, the state picture is coherent: a low and largely static balance, tipped toward the internal dimensions, with a sharp mid-secondary trough across multiple fronts at once, a measured strength in relationships, a steep fall-off in perivallon, and a complete silence on voice. None of that prescribes an intervention. It is the diagnosis that has to come first — the shared state context each Equilibria school report is then read against, so a school can ask not “what program should we buy” but “where are our students, and how does that compare to the state?”
The complete subdomain-by-subdomain detail, with trend classifications for all 23 mapped indicators, is on the By subdomain page. The mapping, research questions and caveats are set out in Method & mapping.